

Influenza Season Analysis
OVERVIEW
During the influenza season in the United States, hospitals and clinics experience a higher influx of flu patients, especially those in vulnerable populations (over the age of 65). To ensure proper treatment for the increased number of patients, hospitals and clinics require additional staff.
PURPOSE
Analysis of influenza death data set by CDC and population data set by US Census Bureau was performed for CareerFoundry Data Analytics Course.
OBJECTIVE
Provide insight on influenza death trend to help medical staffing agency efficiently distribute staffs
Analysis Summary
-
Project took few weeks to complete due to cleaning the data and creating visualizations
-
Influenza Death Data Set
Population Data Set -
Excel & Tableau
-
Data cleaning, descriptive analysis, aggregating data, data visualization and storytelling.
Analytical Approach
-
Renaming and reformatting values for consistency and removing any duplicates.
-
Integrating the two data sets in order to create one data set for further analysis.
-
Find correlation between influenza death of vulnerable population and total population of vulnerable population (individuals over age of 65).
-
T-test to check for statistical significance of the hypothesis
-
Creating charts and maps to provide insights of the data set and highlight the result of hypothesis testing
Tableau Story

Positive correlation seen in this chart indicates that there is a statistically significant relationship between total population of vulnerable population and influenza death of vulnerable population.
RESULTS
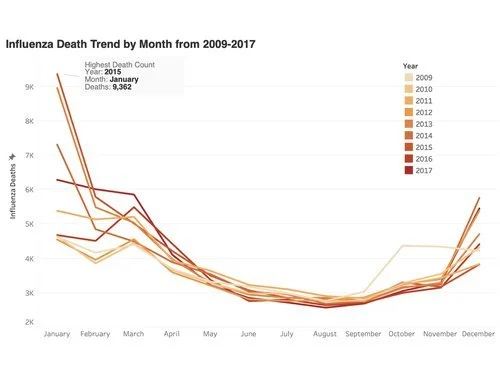
This chart shows that each year has a similar trend in influenza death. The highest death count is in January, and it declines until August and starts rising again through December.

The map illustrates that the distribution of total death counts in each state corresponds to the distribution of vulnerable population death counts.
Conclusion & Recommendations
Limitations
In order to prepare for the upcoming influenza season, additional medical staffs should be distributed in states with higher number of vulnerable population.
Medical staffs should be allocated during certain period with higher risk of influenza death: starting September when influenza death starts to rise and if not suffice, more staffs should be sent out in December or January when the death count peaks.
The data set is missing most current values.
There was no data in regards to staffing availabilities so no further suggestions can be made on appropriate staffing distribution.